Brent crude oil prices rose in March, increasing by USD1.9/bbl m-o-m to USD85.4/bbl. Prices rose due to tighter oil supplies on account of OPEC+ cuts, resilient economic growth, and continued geopolitical uncertainty:
- Global oil demand. Global liquids demand decreased m-o-m by 1.1 MMb/d to 102.3 MMb/d. The decrease was driven by the Middle East and Europe, where demand decreased m-o-m by 0.5 MMb/d and 0.3 MMb/d, respectively
- OPEC 10 production (excl. Iran, Venezuela, Libya). OPEC 10’s production remained relatively steady at 27 MMb/d. In March, OPEC+ members announced extensions of their existing production cuts of 2.2 MMb/d until June 2024, which have kept the USD80+/bbl prices underpinned since July of last year
- Non-OPEC production (excl. US shale). Non-OPEC production decreased slightly by 0.4 MMb/d m-o-m to 60.1 MMb/d. The decline was led by US production, which witnessed a m-o-m decline of 0.15 MMb/d
- US shale oil production. US shale oil production remained steady between February and March at 9.8 MMb/d, after witnessing a 0.5-MMb/d decline in January as a result of shut-downs due to cold weather across the central US. The number of active rigs remained unchanged at 557 between February and March.
- Iran, Venezuela, Libya production. Combined production levels in Iran, Venezuela, and Libya increased slightly m-o-m, averaging at ~5.2 MMb/d for the month of March with only a marginal 0.1-MMb/d change in production from the three countries
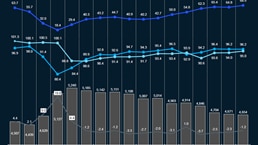
- Commercial inventories.1 Global commercial inventories decreased by ~28 million barrels in March to 4.4 billion barrels with the decrease in inventories almost equally attributed to both OECD and non-OECD countries
- Market sentiment. Although crude oil price volatility has remained relatively lower during the past six months, compared to H1 2023 and 2022, uncertainty around crude oil prices remain due to geopolitical issues across several regions globally and continued OPEC+ supply cuts. Prices were also impacted recently by an attack on a Russian oil refinery, which sent global crude oil prices higher despite the heavy sanctions on Russia petroleum
1 Non-OECD share of inventories is estimated, assuming that non-OECD inventories have 50% days of demand cover of OECD inventories
Download dashboard:
Oil supply & demand dashboard: March 2024
Subscribe to Energy Solutions
To receive our oil supply & demand dashboards, please subscribe to upstream oil and gas updates from Energy Solutions.